I am new to MySQL and using HeidiSQL.
I am trying to update a table that has over 2 million records in it and after 2 hours, i received an error saying "Lost connection to MySQL"
Here is the code I am running
UPDATE KinesisPasswordDatapoint_copy
SET KinesisPassword = (SELECT password
FROM panelist P
JOIN data_oe oe on P.pid = oe.pid
WHERE KinesisPasswordDatapoint_copy.EntityID = oe.data and oe.dataid = 33)
I look at the sessions for the server and it looks like the query is still running. Is it?
how can I not receive this lost connection error?
Lost connection to MySQL
 ansgar posted
9 years ago
ansgar posted
9 years ago
If you see the query running in the process list, then it surely runs. I don't really understand the question. But I guess you wonder why it runs so long?
 jfalch posted
9 years ago
jfalch posted
9 years ago
it probably runs so long because it does one join of two (potentially large) tables panelist/data_oe for each of 2 million Kinesis..whatever records. no need to ask wether there is an index on both .pid fields - this is a monster query and, even when run against a real powerful database server, would take quite a long time. (it's a mere sql server, not a hyperspace miracle machine!)
my 2c: split this into at least two queries: pre-select password and corresponding oe_data once, store them into a temporary table; then update Kinesis..whatever using this table. Saves about 2 million minus one time consuming joins.
my 2c: split this into at least two queries: pre-select password and corresponding oe_data once, store them into a temporary table; then update Kinesis..whatever using this table. Saves about 2 million minus one time consuming joins.
![[expired user #8707]'s profile image](http://www.gravatar.com/avatar/81baadacf39a11c56ee30acd5455fced?d=identicon&s=48) [expired user #8707] posted
9 years ago
[expired user #8707] posted
9 years ago
mainly i wondered is why I got the "lost connection" error and even after I get this error but I still see the process in the process list, is it still running or could it be hung?
Thanks for the suggestion Jfalch
Thanks for the suggestion Jfalch
jfalch posted
9 years ago
in heidisql's process list ('host' tab, subtab 'processes')
a) what is the value of the 'status' field for the running query ?
b) if you press F5 (refresh) several times on the process list, does the value of 'stage' or 'progress' fields change for the running query ?
c) same after waiting several minutes ?
a) what is the value of the 'status' field for the running query ?
b) if you press F5 (refresh) several times on the process list, does the value of 'stage' or 'progress' fields change for the running query ?
c) same after waiting several minutes ?
[expired user #8707] posted
9 years ago
I don't have a status field. I see ID, User, Host, DB, Command, Time, State & Info. Is there a way to add more fields to this screen?
When I was running this query, the State field was saying 'sending info'.
If i refreshed this screen, HeidiSQL would stop responding and sometimes shut down. Then when the application is restarted, I look at the processes tab again. The time keeps increasing on the processes tab.
When I was running this query, the State field was saying 'sending info'.
If i refreshed this screen, HeidiSQL would stop responding and sometimes shut down. Then when the application is restarted, I look at the processes tab again. The time keeps increasing on the processes tab.
jfalch posted
9 years ago
Ok, the field I meant is called 'State' not 'Status'.
For the others, can you scroll the process list horizontally, using the scroll bar at its bottom ? there should be additional fields to the right, Stage and Progress among them. AFAIK this list is not configurable, the fields should be there.
Time is not of interest, it just shows the time elapsed since the query was received, but not what the server does with it.
[expired user #8707] posted
9 years ago
those are the only fields I can choose from. When I click on the bar listing all the column names, a dialog box appears with check boxes to be able to show certain fields or not. All of the fields in the list are being shown.
Is there a way to attach a picture so I can show you?
Is there a way to attach a picture so I can show you?
ansgar posted
9 years ago
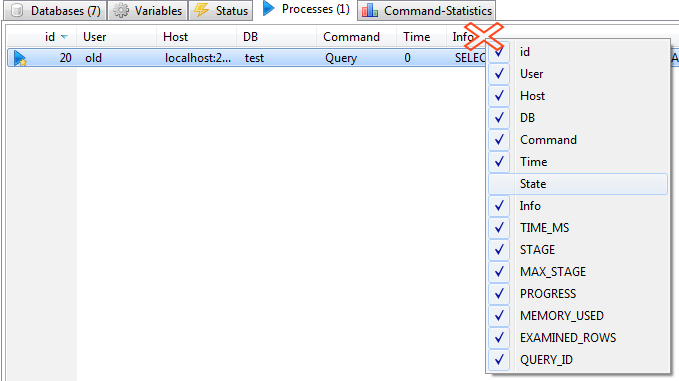
If there is one or another column missing, you can rightclick the column headers, and then activate it:
1 attachment(s):
 jfalch posted
9 years ago
jfalch posted
9 years ago
is there a horizontal scroll bar at the bottom of the process list ? there would be quite some white space above it.
[expired user #8707] posted
9 years ago
If there is one or another column missing, you can rightclick the column headers, and then activate it:
So my list stops at Info. I don't have time_ms, stage, max_stage, progress, memory_used, etc to choose from
is there a horizontal scroll bar at the bottom of the process list ? there would be quite some white space above it.
There isn't a horizontal bar indicating that I can scroll to the right to see more information
I have version 9.1.0.4903 if that helps.
jfalch posted
9 years ago
what happens if you use
show full processlist;
from a query pane ?
show full processlist;
from a query pane ?
[expired user #8707] posted
9 years ago
Only get columns ID, User, Host, DB, Command, Time, State & Info
jfalch posted
9 years ago
please check the user you are using to connect in the user manager, by clicking on it in the lis on the left, and then in the pane on the lower right side click on the plus sign before "Global privileges". Its should show a list of privilege names, each with a check box before it (EXECUTE PROCESS SELECT ...); is the checkbox before PROCESS checked ?
jfalch posted
9 years ago
also, what does the query
select version()
return ?
select version()
return ?
[expired user #8707] posted
9 years ago
The checkbox next to Execution is NOT checked
[expired user #8707] posted
9 years ago
also, what does the query
select version()
return ?
5.5.39-log
jfalch posted
9 years ago
"The checkbox next to Execution is NOT checked" - i did not ask fro that. Is the checkbox next to PROCESS checked ?
[expired user #8707] posted
9 years ago
sorry. yes the checkbox next to process is checked
jfalch posted
9 years ago
Ok. I must admit in this case, and with a recent server (5.5), I have no idea what is happening with your processlist display. Unfortunately, without the missing fields, it is AFAIK not possible to check remotely wether the server is still doing something useful. Do you happen to have shell access to your server (eg via SSH ?)
Please login to leave a reply, or register at first.